The ocean is tightly connected to our well-being, providing a wealth of resources fundamental to human sustenance and global food security, as also affirmed in the sixth principle of Ocean Literacy. Aquaculture offers precious opportunities for us to reduce hunger and improve nutrition while also generating economic growth and tackling poverty. The global relevance of aquaculture was especially highlighted in the UN Sustainable Development Goals (SDGs), particularly in SDG 2 - Zero Hunger and SDG 14 - Life Below Water.
More than 500 aquatic species are currently farmed all over the world, representing a wide range of biodiversity, and aquaculture is practiced by local coastal communities as well as large companies. Based on the data from the past three decades, it is likely that the future growth of the fisheries sector will mainly come from aquaculture.
Comprehending and collecting quality data in this sector, enabling researchers and professionals to perform research across disciplines and countries, is crucial to enable stakeholders in policy making and the blue economy to take evidence-based decisions on the sustainable management of such a precious resource.
The Blue-Cloud demonstrator Aquaculture Monitor is delivering a tool to produce national aquaculture sector overviews, whereby a country can make use of OGC-compliant data services to monitor its aquaculture sector, built on interoperable services where teams can compute and publish reproducible experiments.
This demonstrator is jointly developed by the Information and knowledge management Team (NFISI) of the Fisheries Division, Food and Agriculture Organization of the United Nations (FAO) and the French provider of environmental monitoring solutions Collecte Localisation Satellites (CLS).
A specific Virtual Lab was developed in the Blue-Cloud Virtual Research Environment powered by D4Science, and presented with a public webinar in September 2020 describing its scope, key features and the potential benefits for the aquaculture sector in Europe and beyond.

What can researchers do with it?
This specific demonstrator focuses on detecting and monitoring aquaculture activities over predefined areas of interest using satellite imagery. The service provided is almost fully automatic and will be operational and integrated on our platform by the end of the project.
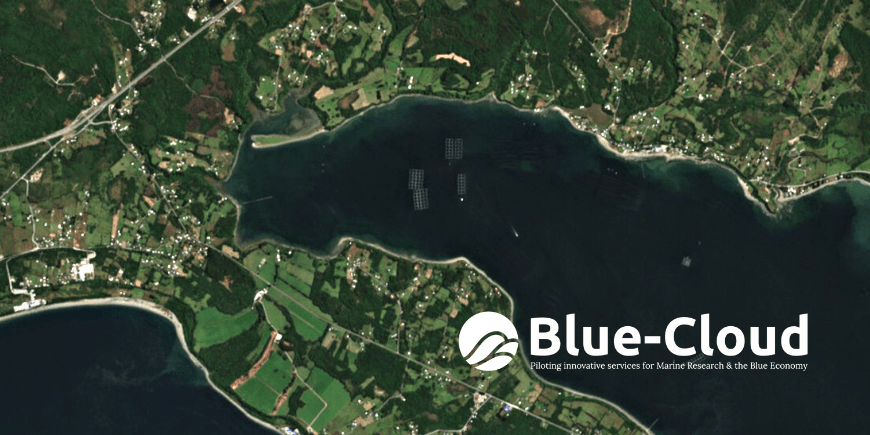
The algorithm was first developed for applications in Puerto Montt in Chile, but has also been tested over Monastir in Tunisia.
It uses open-source Sentinel-1 radar images with a resolution of 10m for high-scale detections, which are downloaded directly from WEkEO. PlanetScope optical data (4m resolution) is then used for more detailed studies.
The main workflow can be divided into three parts, as shown in the figure below: (1) the location of clusters, (2) the retrieval of high-resolution data and (3) the counting of cages.

- Time-series high-coverage radar images are first downloaded around the desired dates and areas of interest. They are then segmented to automatically detect water/non-water bodies, using Random Forest or standard image processing approaches. False positives are filtered out to detect only aquaculture clusters.
- High-resolution data can be downloaded around the areas of interest detected in the previous step.
- PlanetScope images are processed to extract statistical information for each cluster, such as the number of cages, the farm surface, the average cage size.
Note that step 2 and 3 are developed but not yet integrated on the platform, since they strongly depend on the availability of Very High-Resolution data. For now, only farm locations are calculated and sent to the platform for visualization purposes.

The figure above shows the whole pipeline applied to a case study in Chile. The clusters are first located with a precision of 76% (out of 131 clusters) using Sentinel-1 images taken in July 2020. Each cage is then individually detected (in yellow) using crops of the corresponding PlanetScope image. The main source of false positives are small islands that are detected as non-water bodies and have a size comparable to aquaculture clusters.
Test the Virtual Lab
This workflow is an end-to-end pipeline which allows users to detect and monitor aquaculture activities in areas of interest. For now, only cage detection is integrated but statistical information such as the number of cages, the cluster surface and the average cage size can be calculated if Very-High resolution satellite images are available.
Following this workflow over different dates can allow users to monitor aquaculture activity over larger areas and detect statistical changes.
Test the Aquaculture Monitor Virtual Lab
References
- Poster for the Global Conference on Aquaculture, 22-25 September 2021 https://doi.org/10.5281/zenodo.5535562
- M. Assante et al. (2019) Enacting open science by D4Science. Future Gener. Comput. Syst. 101: 555-563 10.1016/j.future.2019.05.063